
(To paraphrase John Ioannidis)
I have a confession to make. I have a pet peeve: It’s statistic hypothesis testing. I hope you won’t hate me for it.
That pet peeve might explain the following post.
That, and the fact that I recently sat at a SIGIR session with a colleague who’s a psychologist. They are much better than Computer Scientists when it comes to statistics.
During said session she pointed out multiple basic statistics errors which should have caused more than half of the papers in that session to be rejected. The most common error (and one that plagued about half the papers in the session) was not correcting for multiple hypothesis testing.
This caused me to tweet the following:

(SIGIR 2025 was held in Padova, Italy)
Once you see something it’s hard to ignore. Over the days of the conference, I saw many more papers where one cannot rely on the results because it’s unclear if they are significant.
The worst case I saw had a presenter showing around 250 numbers on the screen (10 measures and 25 systems, if I remember correctly) and compared pairwise numbers across that table. First, why would you show 250 numbers (at 4-digit precision) in a presentation? But aside from that, isn’t it obvious that so many comparisons need to be corrected, and that they are not meaningful at P<0.05?
After the conference, I took a sample of 64 papers and checked if they compared some measure multiple times (63 did). Among those, 25 (40%) performed statistical hypothesis testing and among this group, only 8% corrected for multiple hypothesis testing. Note that I was fairly lax about when hypothesis testing is required: Specifically, only if there was a table with many numbers that could be compared. I didn’t look for more elaborate cases.
You can visualize this in the chart below:
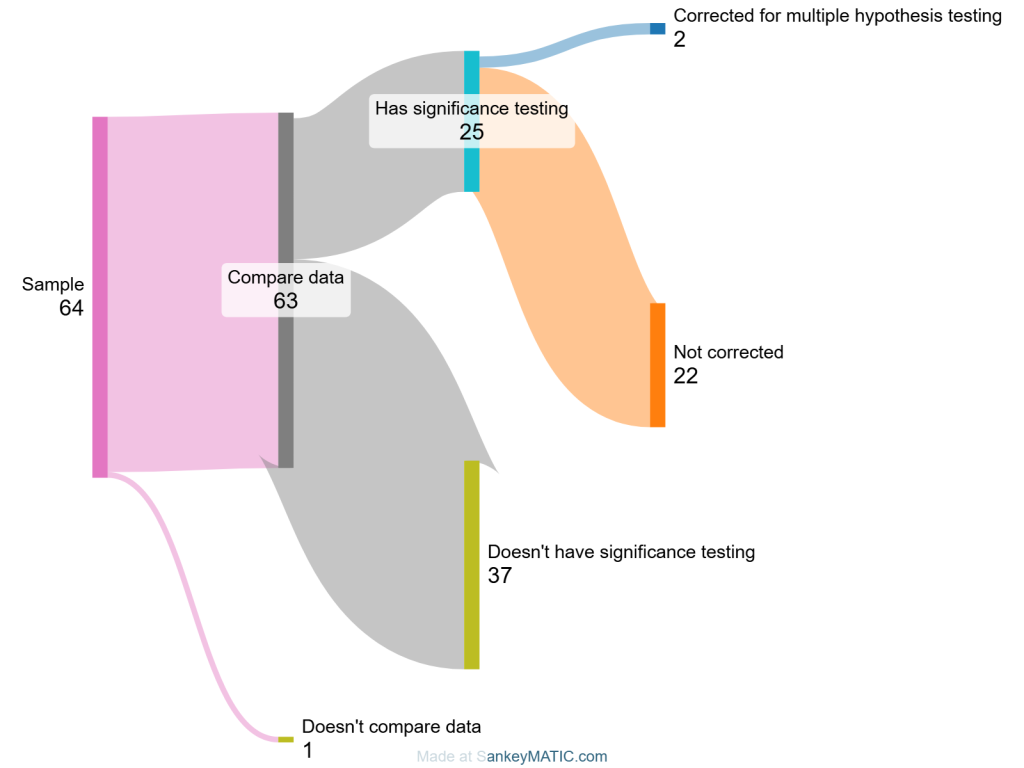
In the past SIGIR papers were known for not conducting hypothesis testing (and ML papers still are), so it’s good to see that 40% nowadays use significance testing. But only 8% corrected for multiple hypotheses (!).
I also checked CHIIR which seems much better in terms of hypothesis testing, but maybe not with regards to multiple hypothesis correction:
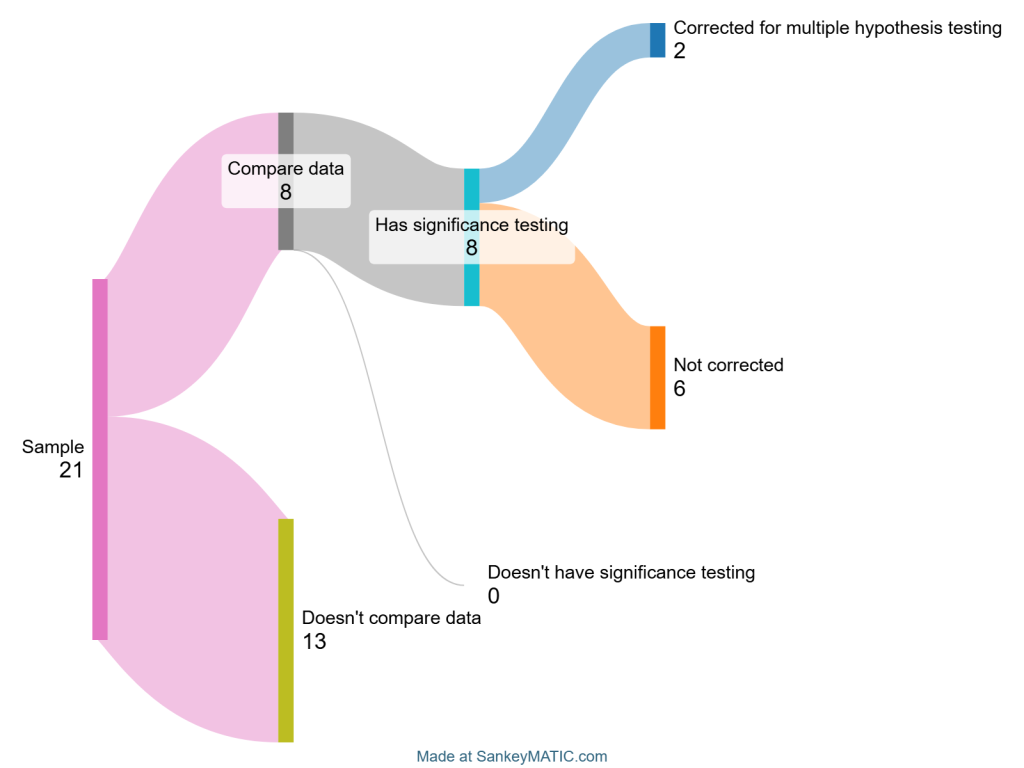
Incidentally, some papers at CHIIR provided more information on their p-values (not just “P<0.05” but sometimes “P<0.01” and “P<0.001” in the same table), which allowed me to estimate how many of their tests would still be significant if corrected using Bonferroni correction. That small sample suggested fewer than half (45%) would remain significant.
Hypothesis testing computes the probability of the null hypothesis given some data. If the computed probability is small, we reject the null hypothesis (and if there’s only one alternative hypothesis, accept that one). As one performs more and more tests there’s a chance of rejecting the null hypothesis simply because our data came from an unlucky draw (in statistics lingo, that’s a risk of increasing the Type 1 error).
It’s easy to see why this problem exists: Suppose you have a coin and you want to determine if it is fair. You decide to toss it 10 times and if in all 10 times it lands on its head, then it’s not a fair coin. The chance of this happening at random for a fair coin is 1/1024, or approximately 0.001. It’s very unlikely that a fair coin will be marked as unfair using your test.
Now, suppose you give 100 identical coins to 100 people and ask them to run the test. One of them may, by chance, get 10 heads. In fact, the chance for it is around 9%. So, even when the coins are fair, there’s still a high chance that you’ll decide they are not. This is the multiple hypothesis testing problem.
Multiple hypothesis testing is a procedure that corrects for this problem, by decreasing the p-value threshold which will cause us to reject the null hypothesis as the number of tests grow. For example, instead of 0.05 we might use 0.01 or 0.001.
The simplest correction is the Bonferroni Correction, where the p-value is divided by the number of tests. Thus, if you test 10 hypotheses, you divide your p-value by 10. There are more elaborate (and less conservative) methods such as the Benjamini–Hochberg procedure. In any case, it’s simple to do once you know you should do it.
So, as a community, let’s insist on both hypothesis testing and correcting for it when doing multiple tests (e.g., comparing P@1, P@5, P@10 and MAP). Otherwise, we risk falling into the trap pointed to by John Ioannidis in “Why Most Published Research Findings Are False” (and from where the title to this piece is taken from).
Now don’t get me wrong: I’m as guilty as the next person for not correcting for multiple hypotheses, and you’ll easily find papers of mine where I should have done proper correction and didn’t know about it. But perhaps we can start doing better?
Bonus: If you’re comparing multiple algorithms on multiple datasets, use Demsar’s paper, rather than pairwise tests. Certainly, unless you have a good reason, don’t use t-test but it’s non-parametric version.
Amen.
The second most common misunderstanding is that assuming that picking the treatment as the winner when p-value = 0.01, for example, means you’ll be wrong only 1% of the time.
People forget that p-value is conditioned on the null hypothesis being true, and you need to apply Bayes Rule.
See https://bit.ly/ABTestingIntuitionBusters
Thank you for bringing this up (again), and for the nice analysis.
In 2018, I wrote a SIGIR Forum article about the multiple testing problem and other errors frequently observed in experimental IR papers:
https://sigir.org/wp-content/uploads/2018/01/p032.pdf
Obviously, nothing has improved in the meantime. Seeing that I am not the only one getting upset about these examples of bad science, I will continue the fight for better experimentation in IR.
Ben Carterette has a good paper about multiple comparisons:
Benjamin A. Carterette. 2012. Multiple testing in statistical analysis of systems-based information retrieval experiments. ACM Trans. Inf. Syst. 30, 1, Article 4 (February 2012), 34 pages. https://doi.org/10.1145/2094072.2094076