
TheWebConference 2025 began today, marking the culmination of almost a year’s work for Helen Huang, Liane Lewin-Eytan and myself as the Program Committee Chairs. In the opening session today, we gave a few statistics which may be of interest for others engaged in similar endeavors and perhaps to scientists in general.
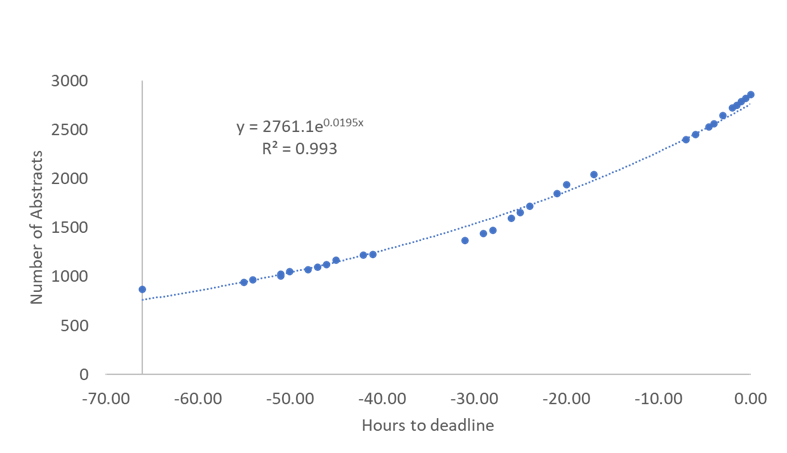
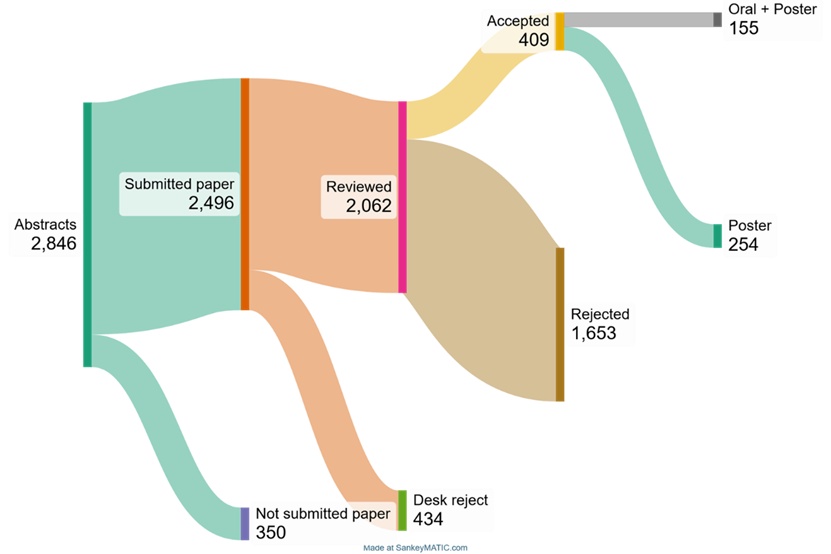
As the figure below shows, we received 2846 Abstracts and, a week later, 2496 full papers. As we approached the deadline the rate of submission increased exponentially, as shown in the figure below.
We desk rejected 434 papers because they did not adhere to the guidelines (e.g., not anonymous, over length), submitted in parallel to multiple conferences, or irrelevant to the conference. Thus, 2062 papers were sent for reviews and following the review process, 409 were accepted to the conference. The acceptance rate was therefore just shy of 20%, in line with previous conferences.
We sent each paper to 5 reviewers and, on average, received 4.6 reviews per paper. We had at least 3 reviews per paper and, when we didn’t receive the reviews in time, we assigned emergency reviewers, so a few papers received up to 8 reviews. Nevertheless, reviewer load was very reasonable, with 3.3 on average.
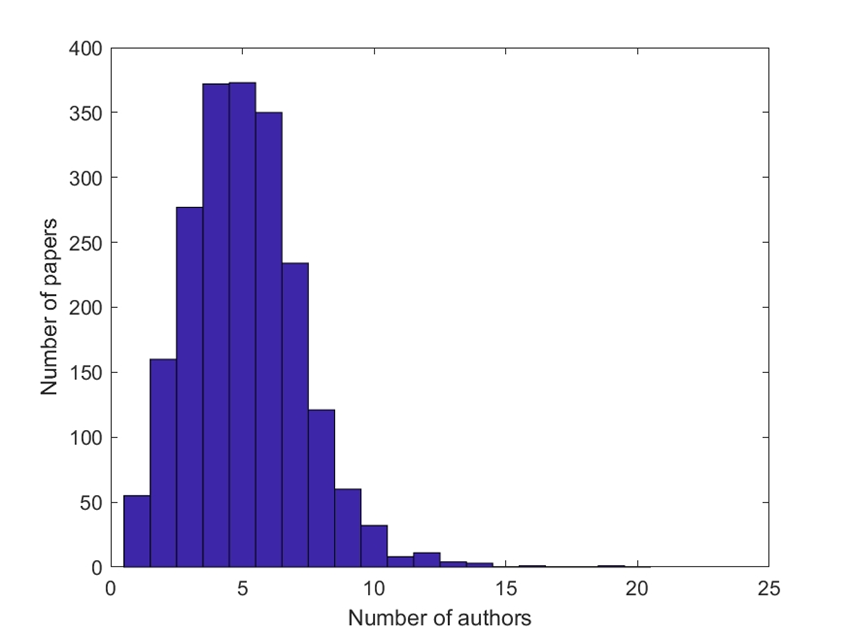
The figure below shows the distribution of the number of authors per paper. Interestingly, accepted papers had a median of 6 authors per paper, while that of rejected papers only 5 (statistically significant, Kruskal-Wallis test, P<10-6). Perhaps one should invite more co-authors to increase the chance of success?
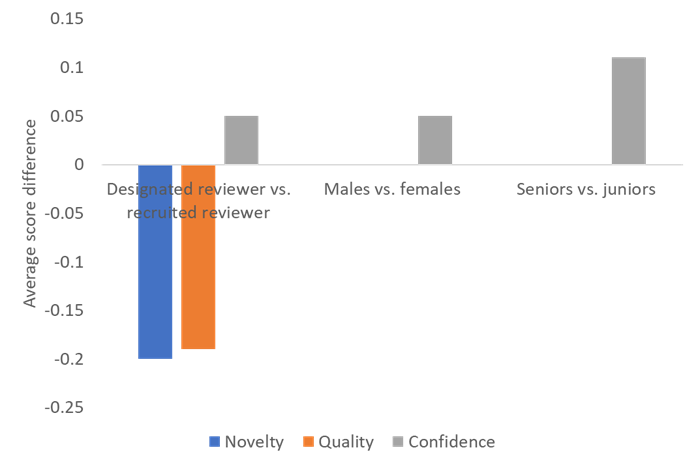
This year we recruited reviewers before the submission deadline, but we also required the authors of each paper to designate one author to review papers. As the figure below shows, these reviewers seemed to act strategically, assigning a lower novelty and quality score to other (competing) papers, compared to the recruited reviewers, and claiming to be more confident. However, the difference in scores was low (0.2 points or less on a 7-point scale), so probably meaningless.
Incidentally, the figure was created by matching reviewers by papers, that is, we calculated the difference in scores in each paper and then aggregated across papers.
Other significant differences were that males were slightly more confident than females and senior reviewers (e.g., professors) were more confident than junior ones (e.g., students). Perhaps also of note is that there was no difference in novelty and quality scores given by males and females, and by junior and senior reviewers.
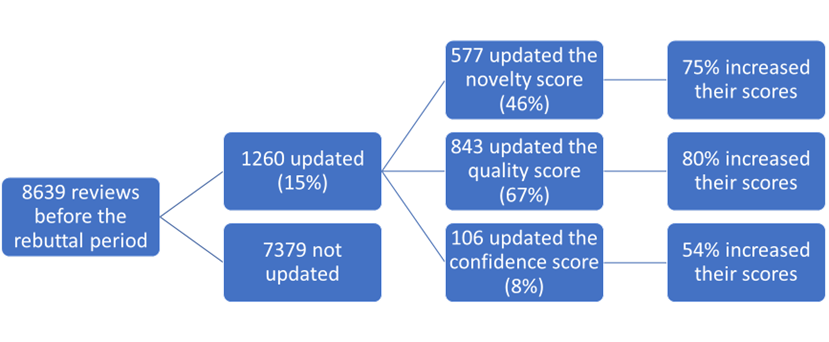
After the review period we had a response and rebuttal period, where authors could comment on the reviews and clarify outstanding issues. As the figure below shows, 15% of reviews were changed by the end of this period, with 46% changing the novelty score, 67% the quality score and 8% the confidence score (some changed more than one score), with the vast majority increasing their scores.
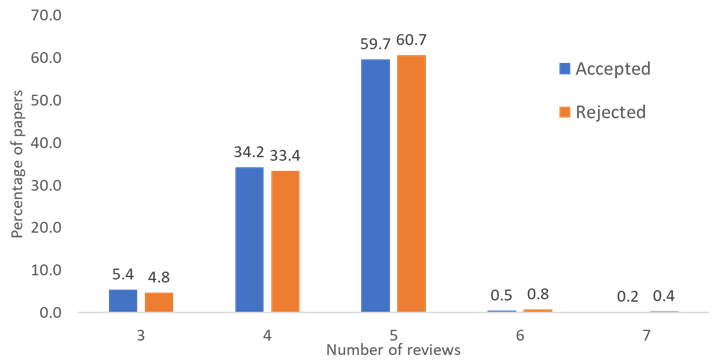
The NIPS experiment showed that the more reviews a paper receives, the less it is likely to be accepted. We tested this with observational data (see below) and did not find such a trend (P>0.05). However, ours was not an AB test like the NIPS experiment.
Finally, we tried to see if ChatGPT could save us the arduous review process. We sent 200 random papers to ChatGPT4o and asked it to score the papers with instructions similar to those given to reviewers. We ran two experiments, sending either the Titles and Abstracts or, separately, the full papers to the LLM. The ability of the scores given by ChatGPT to predict the outcome of the human review process were basically random predictions: The Area Under Curve (AUC) for the titles and abstracts was 0.58 and for the full papers 0.43. For comparison, the scores from a random reviewer would give an AUC of 0.8 and those of the average score of reviewers 0.9. Therefore, if we assume that the human review process is the standard we should be aiming for, ChatGPT is not a viable alternative.