
As few years ago there was a lot of publicity (e.g., NY Times) to papers which showed that AI systems, especially commercial ones, were biased against certain minorities. As is often the case in science, one paper that gets lots of publicity is followed up by additional papers that investigate the same or similar phenomena. Now that there are quite a few papers of this sort, it’s time to do a meta-analysis and see if there was substance to these claims.
Meta-analyses are useful tools to collect all the experiments that have been done about a topic and summarize them. Experiments vary in their size, methodology, data, etc. Meta-analyses try to pool them together and return a single message that takes all that’s known into account. As Ben Goldacre showed in his brilliant (and highly recommended) talk, there’s a simple chart that can be used to conduct this summary. It’s called a Funnel Plot.
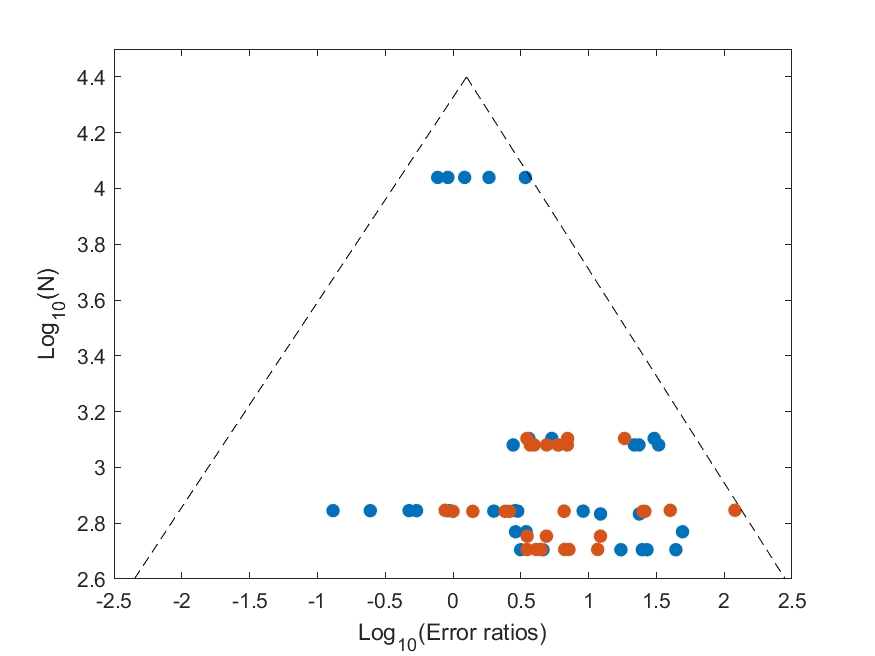
In this two-dimensional plot, the horizontal axis represents the effect size reported in the experiment and the vertical axis the size of the population in the experiment. Each dot on the plot is one experiment. Small experiments (close to the horizontal axis) will have lots of noise and the effect size will be either larger or smaller than the true effect size. As one conducts experiments on more and more samples, the noise is reduced, and the results concentrate around the average effect size. The result should look like an isosceles triangle, where the top of the triangle is the true effect size.
What happens if there is publication bias? In that case, the triangle disappears: For example, it’s been shown that with medical drug trials, some trials go unreported (think about those done by the pharmaceutical company or it’s collaborators). It’s hard to hide the results of large trials, so the trials that go missing are small trials that showed a negative (or no) effect. In that case, the funnel plot will be missing some of the points on the left-hand side. In extreme cases the triangle will now be right-angled triangle.
I decided to do a small meta-analysis of studies that looked at bias in face recognition systems. These are systems that infer the gender of an individual from a photo, usually of their face. The claim was that these systems tend to make more mistakes when the image presented to them is of a female or of someone with darker skin color. To conduct the metal-analysis I used Google Scholar and Elicit to look for experiments that quantified bias in face recognition systems. I found 6 such papers, with a total of 98 experiments.
I quantified the effect size (the horizontal axis) as the logarithm of the ratio between the error of the presumably disadvantaged class (females or dark-skinned individuals) to that of the presumably not disadvantaged class (males or light-skinned individuals). The experiment size (the vertical axis) is the logarithm of the number of cases in each experiment.
You can see the result in the graphs below. They differ in their inclusion or exclusion of the point on the right-hand side which showed a very large effect. Regardless of the figure you chose, two things can be seen: One is that there are indeed missing experiments on the left hand-side, meaning that there’s publication bias in studies of bias… The second is that the effect size is around 26% (or 38% in the second graph). That is relative effect size, meaning that, for example, if the error rates for detection of males is 1%, the error for females is 1.26%. Significant, but quite small.

However, if my findings are correct, why are these studies missing? It’s hard to know for certain. It could be that there’s not enough work in this field. My guess is that people who found negative effects chose not to publish them or were unable to do so because publication venues prefer to show a specific message (here’s an interesting case in an unrelated field).
This is a very small study, based on only 6 studies (and 98 experiments), my decision on the “disadvantaged class” is arbitrary (though made in the papers), and there are very few datasets analyzed in the papers. So take this with a grain of salt (do we need meta-analyses of meta-analyses?).
However, assuming that there are missing experiments, my guess is that it’s by design. This is based on my anecdotal experience: Over the years I’ve worked with people from many scientific disciplines. There’s one scientific discipline where my experience has been a little strange: Ethical AI — the same field that’s interested in bias in face recognition systems. While I’ve worked with several excellent scientists in that field, I also had three projects where ethical AI researchers came to me for help in looking into specific questions in their field, using my methods and datasets. I analyzed the data and tried to do my best to see if they supported the hypothesis. When it turned out they didn’t, two of the researchers disappeared. They simply stopped responding. One told me outright that she wouldn’t publish data that goes against her beliefs.
What’s the takeaway from all this? Perhaps only the trivial one: When you hear a strong scientific claim, perhaps it’s better to wait a while until more evidence is collected before making one’s mind about that claim.