There are reports of a Respiratory Syncytial Virus (RSV) outbreak in Israel. RSV is a virus which causes a flu-like illness and is especially dangerous for children. What’s strange about this outbreak is that it’s happening in early summer, whereas previously RSV outbreaks always happened in winter.
I was wondering if this is something special to RSV and to Israel or perhaps something bigger?
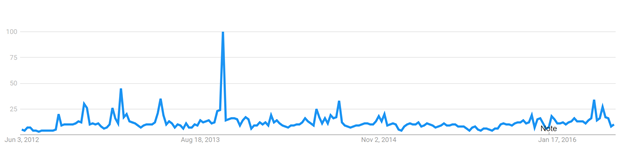
Luckily, a few years ago we looked at the association of search engine query volume and the incidence of RSV and found that it was quite high. Therefore, I extracted Google Trends data (using the Google Trends Anchor Bank toolbox) for RSV from the US, United Kingdom and Canada and plotted it below:
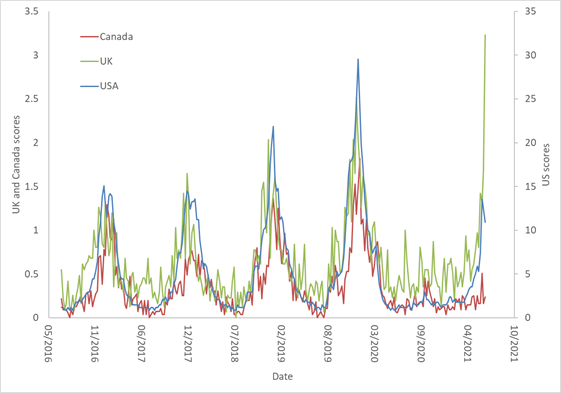
However, starting from April 2021 there is a dramatic rise of RSV in the US and UK, but not in Canada. Thus, Israel is similar to US and UK, but Canada seems an outlier.
Is there something special about RSV?
Here are the time series for several other seasonal viruses in the US:
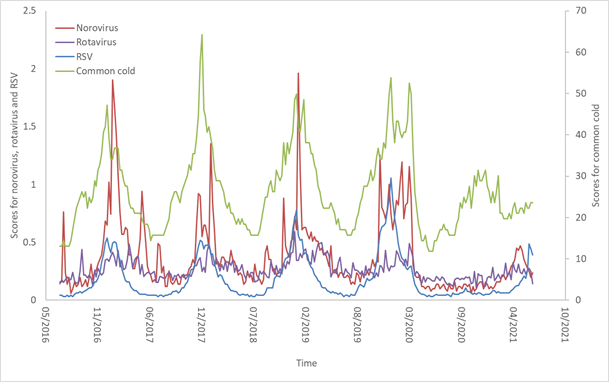
Here we see similar correspondence, except for two outliers: First, common cold queries happened in the winter of 2021, but to a lesser extent. Second, RSV is rising, but so is norovirus, which started earlier and may already be on its way down.
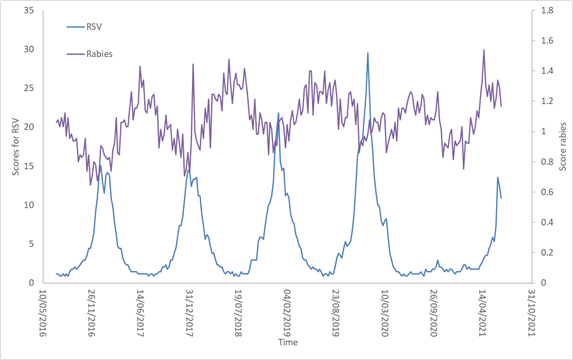
Here is another virus, Rabies, compared to RSV. Rabies usually spike in summer, and in the summer of 2020 there was no spike. This year, however, it seems to be rising to normal levels. Note that it is unlikely that the search query volume for rabies represents rabies cases, as it does for RSV. Even though there is evidence for seasonality of rabies, in this case it probably reflects worry about rabies due to close contact with mammals.
What’s happening here? Perhaps opening up for social gatherings in Israel, US, and UK have enabled RSV and other viruses to spike. We are looking into whether there is supporting evidence for this question.
These findings raise the interesting question of why RSV (and other viruses) occur in winter? Is it because of the colder weather which causes people to congregate indoors and perhaps constricts our airways? Is it because there is some level of immunity in the population which slowly decays over the year until, early in winter, it is low enough for an epidemic to begin?
COVID19 may allow us to resolve this question.
(Special thanks to Prof. Lev Muchnik for interesting discussions on this topic)