Should the president be impeached? It all depends who you ask

“The President, Vice President and all civil Officers of the United States, shall be removed from Office on Impeachment for, and Conviction of, Treason, Bribery, or other high Crimes and Misdemeanors.” Article II, Section 4, US Constitution

Professor Anat Rafaeli and I teach a course at the Technion which is intended to teach students with a background in psychology the tools of Data Science and specifically how to answer research questions from the social sciences with internet data. As part of the course, students chose a research question and answer it during the semester, using the tools we teach them.

A couple of years ago, while explaining their research question, one of the students (whose name I don’t have anymore, but will be happy to add him, if he’s reading this) showed us an intriguing chart: It displayed the search volume (from Google Trends) for the term “impeachment” for the period of a few months before and after President Trump was inaugurated. There were several spikes during that year from people searching for how to impeach the president. I didn’t find this particularly surprising given the news coming from the US.

What was surprising was a similar chart he showed us for the same period around President Obama’s inauguration. It showed similar spikes! I hadn’t heard of anyone who wanted to impeach Obama, so that spike was shocking to me.

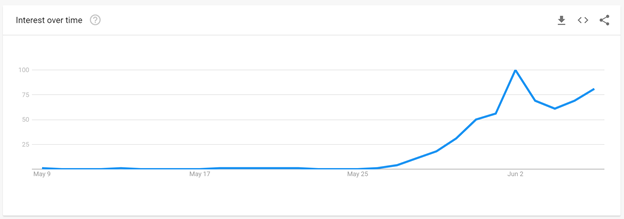
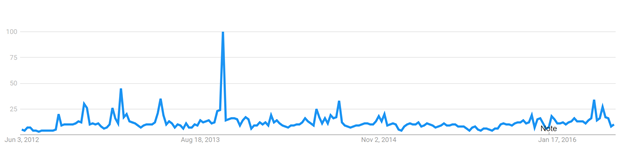
Recently I repeated the exercise this time adding data from similar time periods around President Biden’s inauguration (Technical note: For the first two presidents I used the “impeachment” topic, while for Biden I used the term “impeach Biden”, to exclude searches related to Trump’s impeachment trial). You can see the results in the figure below.

Search volume for impeachment during the months before and after inauguration of presidents Obama (blue), Trump (orange) and Biden (gray).

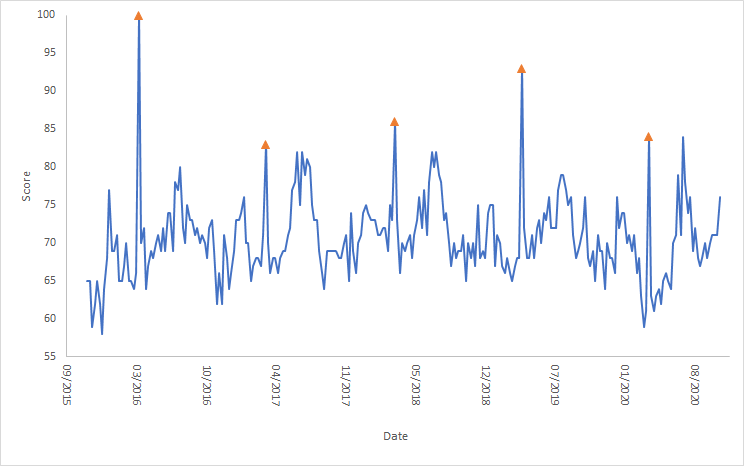
As you can see, each president has people searching for how to impeach them, first around the time that they are elected and then around inauguration. After these two events “impeachment” spikes every so often (as you can see in the Obama and Trump spikes at the end of May). More broadly, here’s Obama’s entire second term:

Google Trends search volume for impeachment over the period of President Obama’s second term in office.

Who are these people, who are so eager to impeach their president?

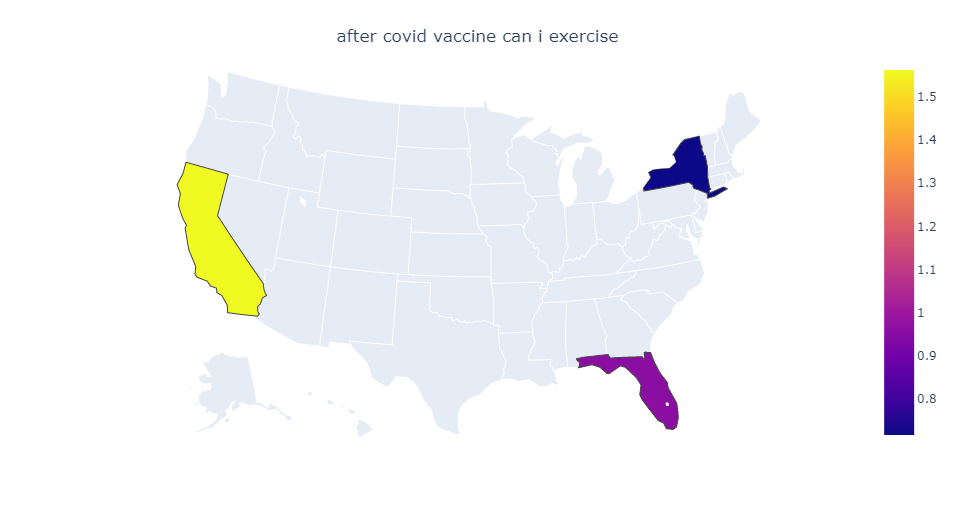
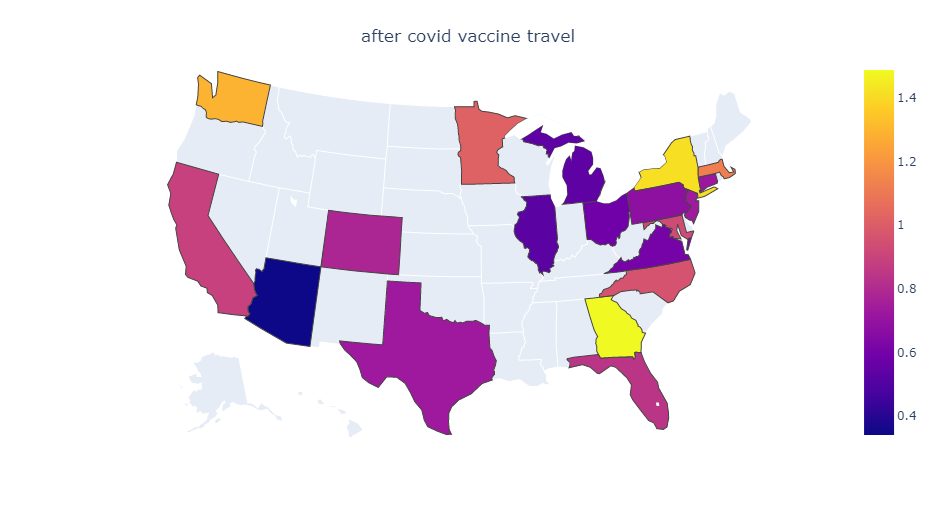
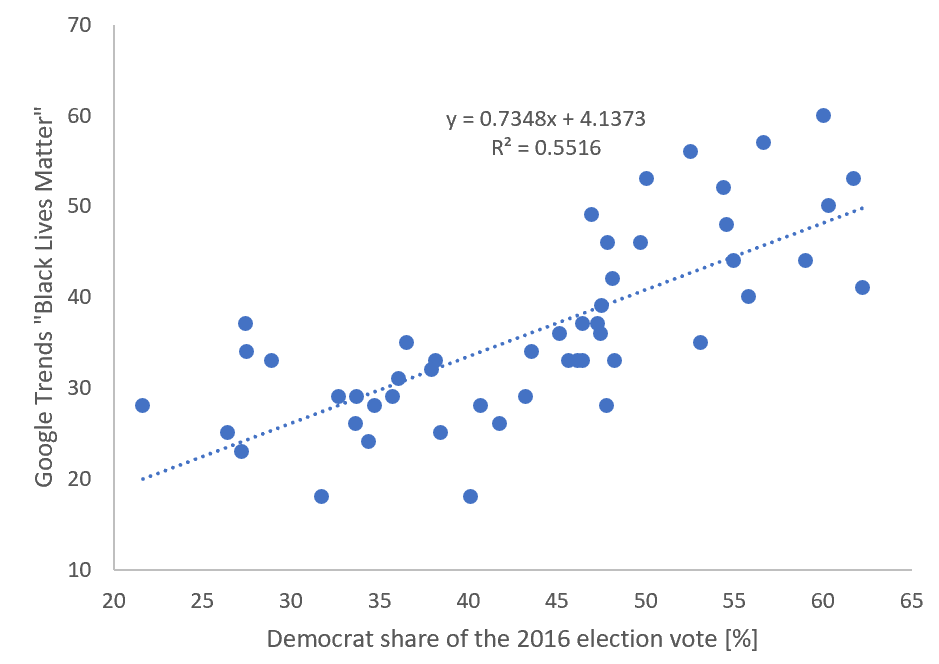
We can try to answer this question by looking at the correlation between how each state voted in the recent Presidential elections and the percentage of people searching for impeachment of a president. The graphs below plot the percentage of people in each state who voted for Biden as president (i.e., roughly speaking, are Democrats) compared to the search volume for impeachment.

Percentage of Biden voters in each state (Democrats) versus search volume for impeachment of Obama (top), Trump (center) and Biden (bottom). Outliers are marked.

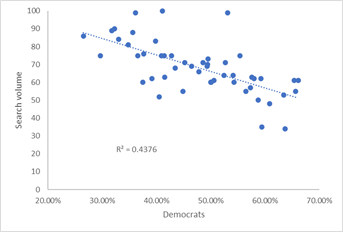
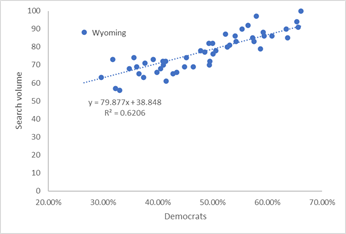
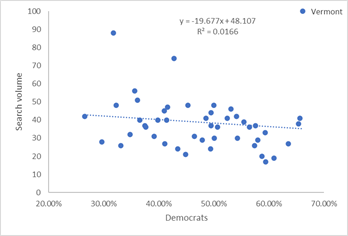
People who wanted to impeach Obama where mostly from republican states, as shown by the negative correlation between search volume and the percentage of Democrats in the state. The opposite is true for people who search for impeachment during Trump’s first months in office. With Biden the correlation is much worse, but the data is skewed by a single point when, if removed, is again reasonable (R2=0.13): For some reason, the mostly Democratic voters in Vermont are those searching more often for Biden’s impeachment.

What’s the bottom line? If you don’t know anyone who thinks your favorite president should be impeached, you just don’t know the right people.

Can we predict a stroke event?

Our newest paper suggests an intriguing possibility: We may be able to predict a stroke event by observing people’s activity on a search engine.

What does the evidence show?

We started with a group of anonymous Bing users who, at some point, indicated in their queries that they had undergone a stroke. We filtered these users to those who were active pretty much every day, then they were inactive for between one and several days, and indicated their stroke just after that inactivity period. We hypothesize that the inactivity was due to their stroke which happened just after they disappeared. We then tried to separate these users from other users, some who were of similar ages and others who indicated having other medical conditions.

To separate the users we represented them through a variety of attributes such as the time of day of queries, the time since their previous session, etc., but more importantly, attributes which were previously linked to cognitive decline such as the complexity of queries, the deepest link that was clicked, and more.

We found was that it was quite easy to separate these populations of users. Of course, it may be that there were other things that were different between these populations even though we took care to select them in the same way that we chose the stroke population. However, we did find that people with cardiovascular diseases were harder to differentiate from the stroke population than people with other conditions.

We also applied our model to data that was collected a year later. Here we didn’t have many people who indicated a stroke, so used a weaker label, which was the number of times each user was interested in stroke. This is an indicator that was used in the past to find people who are suffering from cancer. The model successfully found those people who are interested in stroke, just by looking at the meta data of their queries, through attributes such as those described above.

Predicting when a stroke will occur

It seems that it’s possible to differentiate populations of users who will undergo stroke from others. Can we also localize the stroke in time? That is, can we predict if a stroke will occur within the next few days?

The results here are not as strong, but they do indicate the possibility of localizing the stroke event. According to our findings, in in the 3-4 months prior to the stroke event something begins to change and peoples attributes begin to be more similar to those of people who will undergo a stroke. This could be because of microstrokes or other cardiovascular events.

The summary of our findings is the intriguing possibility that stroke causes cognitive changes some time before a stroke happens, and that these changes can be identified through people’s interactions with search engines. If this is true, the upshot could be dramatic: We may be able to prevent stroke by analyzing people’s queries and, if they indicate a possible event in future, have doctors prescribe simple medications such as aspirin. As our medical partners (Prof. Stern and Dr. Shaklai) said, there’s a lot to do before stroke and not a lot after it.

However, all our data is derived from queries of people who indicated their health conditions. We don’t have their medical records. Therefore, we’re now trying to set up a clinical trial which will collect both query data and medical records from people and validates our hypothesis.

What do you want to do after you get your COVID19 vaccine?

 As I write this blog post (May 18th, 2021), more and more people have been vaccinated against COVID-19. In the US, 47% of the population ever seized the first dose of the vaccine and another 37% are fully vaccinated (https://usafacts.org/visualizations/covid-vaccine-tracker-states/). In Israel around 70% of the population are fully vaccinated.

I thought to try and find out what people were most looking for now that COVID-19 will not be a risk for them. I started with Google’s autocomplete:

As you can see, some people want to know how to deal with the immediate aftermath of the vaccine. They ask about Tylenol and other pain medications, but also how soon they can eat, drink, or smoke. Many people ask about things they could do before COVID-19 but not during the pandemic. These include travel and exercise (presumably at the gym).

A fun exercise is to look at these needs across U.S. states and across different countries of the world. To do this, I queried Google Trends for the volume of queries for each of these needs (e.g., “after covid vaccine can I smoke?”) during the past 3 months and also for the volume of queries beginning “after covid vaccine”. The latter served as a baseline. I calculated the ratio between these two volume indicators given for each state. On a technical note, Google only gives a normalized score for each of the volumes, so we can’t treat this as excess searches per-se. Also, if the volume of queries is too low Google does not provide a number and these are missing data for us.

Interestingly, the correlation between query volume for “after covid vaccine” and the percentage of fully vaccinated people in each state is quite high at 0.80, and only sightly lower (0.78) with the percentage of people who received at least one shot. Therefore, this does seem like interest by people who are getting their vaccines.

Here are maps for these ratios, first for the immediate interests and then for the longer-term ones:

Gray countries are those for which there were too few queries. Colors represent how much more volume there was for the query in the title compared to the query “after covid vaccine” (scale is on the right of each image).

Side effects seem to worry everyone, but the least likely to be worried are people from South Dakota, Maine, Montana and Nevada. Californians and New Jerseyites really want their Tylenol. Once they stop worrying about their vaccines, many Texans would like a smoke and a drink (but drinking is also a favorite in California and Ohio).

As for the longer-term wants:

Gray countries are those for which there were too few queries. Colors represent how much more volume there was for the query in the title compared to the query “after covid vaccine” (scale is on the right of each image).

Californians (of course?) want to go back to the gym. Travel is yearned for in Georgia, New York and Washington.

Worldwide the data is much sparser. This is probably because I’m looking at queries in English. Nevertheless, here are some findings of note: Folks in the Philippines would like to go back to the gym. Alcohol is sought by people in Mexico, UK, India and (presumably expats) in the UAE. This is also true, albeit to a lesser extent, in Canada and Australia. Travel features high on the list for UAE, Canada and Australia.

What does all this mean? Probably not much beyond the obvious, but it’s still fun to see it in the data.

Should we expect a surge of COVID19 babies?

When the COVID19 pandemic began spreading, people started making predictions on what its short-term effects would be. There were predictions of a global recession, more home cooking, and even a rise in the divorce rate. One prediction was highly specific: There would be many “COVID babies.

I’ve been trying to figure out if that prediction is true using search data. Here’s the trend of searches for pregnancy tests in the USA for the past 5 years, taken from Google Trends. It tells an interesting story.

As you can see, every year at roughly the end of march or early April there’s a spike of searches. I’ve marked them with triangles. There is also a wave of searches around the July timeframe.

The spikes correspond to the week or two after spring break. You can guess why… The July surge might be related to planned spring babies or perhaps it’s summer love?

But what happened this year? Interestingly, there’s a drop in searches corresponding to the time of the beginning of the pandemic. Perhaps people couldn’t go out to buy pregnancy tests or perhaps they were under stress due to the pandemic so they couldn’t care for those tests. Interestingly, spring break spike is there in all its glory. So is the July surge. In fact, it’s probably larger than in most years, seemingly compensating for the March dip.

Therefore, the bottom line is, there’s no abnormal spike in searches for pregnancy tests in the USA since the pandemic began. Does that mean there won’t be a surge of babies in another few months? I don’t know, but my guess is, probably not.

Black Lives Matter – Is it a party-political issue?

Black Lives Matter protests have been dominating my Twitter feed for the past several days. Google Trends data shows a similar trend:

(Interest in “Black Lives Matter” in the US over the past 30 days)

But is it the same experience across the US?

It turns out that interest is strongly related to political affiliation. Here is a scatter plot of Google Trends interest in “Black Lives Matter” at the US state level, compared to the percentage of the vote for Clinton in the 2016 presidential elections.

(50 states, excluding Washington DC)

The fit is pretty remarkable (55%), with states that have more Democrat votes showing more interest in the topic.


State which defy the trend are Utah, Idaho, and Wyoming (more interest in the topic than expected by their voting patterns) and, on the opposing side, Mississippi, South Dakota, and Florida (less interest than expected). Also, anecdotally, the “Related queries” shown by Google Trends in California and Oregon are related to donations to Black Lives Matter, whereas in Mississippi and Florida they are for merchandise.


I also tested interest in the terms “protests” and “looting” across the different states. The former behaves similarly to “Black Lives Matter” while the latter had a similar trend to that of “Black Lives Matter”, only breaking for highly Democrat states, where there was far less interest in looting than expected by the overall trend.


Political scientists may want to theorize if this will change election results, but at least overall the pattern seems to suggest that this is (still?) an issue where interest depends on who you vote for.

Addendum (16 June 2020):

In July 2016 large-scale Black Lives Matter demonstrations were held in 88 cities. Google Trends data from that period (May – July 2016) shows no correlation (R2=0.00) with voting patterns.

A few thoughts about virtual conferences

I attended the first virtual edition of TheWebConference last week. The conference was planned as a conference with physical attendance. The organizers decided to make it a virtual conference a few weeks before it began. I have to applaud the organizers who managed to make this change which is extremely challenging on many levels.

I attended several sessions and I have to say that my experience was not wholly positive (by no fault of the organizers), partly due to objective reasons and partly because of things that we might learn to do differently.

Objective problems: A virtual conference offers the possibility for many more people to attend. On the other hand, it also means that there are significant time zone problems. Owing to the location of Taiwan, I’m guessing that people from time zones of India and up to Australia could probably comfortably attend the entire conference. People in the west coast of the Americas likely attended the morning sessions and those in Europe the afternoon sessions. I’m not sure what people on the east coast of the Americas did… I don’t see how we can overcome this problem, but time zone differences mean that the conference audience is spread over multiple sessions. All the sessions I attended had fewer participants than what I would have expected in a physical conference.

Things we can do differently:

Questions and participation: For some reason, it felt as though people were less comfortable asking questions. This was true even at a virtual poster session which I participated in. Perhaps, just as we have a Session Chair, we should have a secret “session question asker”, who will ask the first questions to help others participate? (and no, the fact that the Chair asks a question didn’t prove to be a good solution)

Socializing: One of the main reasons I go to a conference is to have informal conversations with people. This didn’t happen in the virtual setting, and I don’t know how we can make it work. Perhaps hold virtual lunches?

Disconnect from other work: One advantage of going to a conference somewhere is that I (mostly) disconnect from other work and dedicate those few days to being immersed in the conference. Since I was home, it was much harder to disconnect. I felt as though the conference was the side show to my usual work. This is probably something I can learn to do…

Virtual conferences potentially have advantages over physical conferences, for example, in the fact that they open their (virtual) doors to more people, some of whom would not be able to travel to a physical conference. As more conferences will be moving to a virtual setting, at least for the next few months, we should give more thought to how we maintain the benefits of the physical conference as well as realize the benefits of being on a virtual conference.

This ad may save your life

Internet advertising systems know a lot about us. If you want to know how much, head to Google’s web page on ad personalization (https://adssettings.google.com/u/0/authenticated). On a recent visit I found out that Google knows of my upcoming travel plans to Italy and Texas, a few of my hobbies, and several academic topics that I’m learning more about. Unsurprisingly, it wasn’t correct on everything (I’m not into extreme sports), but it knew a lot more than I would have imagined before I visited their web page.

Over the past few years our and other research groups have shown that interactions with search engines can be used to screen people for a variety of serious medical conditions, both mental and physical. These include depression, eating disorders, Parkinson’s disease, several types of solid tumor cancer, and diabetes. However, informing people about these inferences is challenging both technically and ethically.

This week we published a paper (https://dl.acm.org/doi/10.1145/3373720) showing how to leverage the information that Internet advertisers have about us, to screen for 3 types of cancer. Our results suggest that it’s indeed possible to screen people for their likelihood of suffering from cancer before they are diagnosed by a doctor.

Here’s how it works: when an advertiser uses Bing or Google to advertise, they select keywords such that when a user searches for these keywords their ads are shown. A more sophisticated form of advertising happens when, in addition, advertisers tell Google or Bing whenever a user who saw the ads buys the product they were trying to sell. When advertisers do this, the advertising systems learn to predict who, among all people use the keywords, are likely to buy a product (technically this is known as conversion optimization). This learning is based on the information that advertising systems have about users, including their interests, locations and demographics.

What we did was to leverage this capability and use the advertising system to screen people for cancer. We achieved this by showing an ad to people who searched for information on self-diagnosis of lung, breast or colon cancers. The ad suggested help in understanding the severity of the symptoms that people were experiencing. People who chose to click the ads were directed to a website where, after explaining the experimental nature of the system and asking for their consent, they were given a clinical questionnaire about their demographics and symptoms. People who answered the questions were given one of two indications: either that they should urgently seek medical attention, because their symptoms were deemed serious, or that it was likely that their symptoms weren’t indicative of cancer but medical advice should be sought, though not urgently.

When the questionnaire indicated that a person was likely suffering from cancer, we informed the advertising system that the person “bought” our “product”. Within 3 weeks, the advertising systems learned to focus on those people who probably have cancer, such that approximately 1 in 10 people who completed the questionnaires were likely suffering from it, up from the baseline rate of under 1%. This rate was similar for all three types of cancer.

The use of ads offers a method for interacting with people who might be suffering from as-of-yet undiagnosed cancer. By providing ads with an offer of help and empowering people to select whether or not they wished to receive this help, we overcome many of the ethical challenges associated with unsolicited diagnosis. Our use of the sophisticated capabilities and knowledge about users that advertising systems have, allows us to identify people with serious disease, without having to have access to sensitive individual-level search data.

Interestingly the people who use the system most came from countries with high Internet use and lower life span. The latter is a known proxy for the quality of the health system.

Many health organizations use internet advertising for awareness campaigns and for campaigns designed to encourage healthier behaviors. Our results lead us to suggest that health systems should leverage the information that advertising systems collect about people in order to improve population level screening programs.

Jeffrey Hammerbacher (at the time at Facebook) once commented that “The best minds of my generation are thinking about how to make people click ads. That sucks.” Let’s make use of the products of those great minds to improve outcomes for people with serious disease.

Multi-season analysis reveals the spatial structure of disease spread

One of the most common ways to model the spread of an infectious disease in a population is through compartment models, so called because they divide the population into compartments, with each person residing in one compartment. Perhaps the most common variant is the Susceptible-Infected-Recovered (SIR) model, where people are in one of those 3 compartments. A simple set of 3 differential equations describes the movement of people between these compartments. Thus, for example, the number of infected people in the next time step is dependent on the number of currently susceptible individuals, the number of infected people they come into contact with, and the infection rate, minus the number of people who recover in a time step.

However, in most cases people don’t just belong to one compartment, because populations are not homogenous. For example, it makes sense to divide the population not just to the SIR compartments but also according to the country they live in.

Today we publish an extended SIR model which can model homogeneous populations, divided, for example, by area of residence, age group, etc. By fitting the model to Google Trends data for two common viruses, we reveal information about the complex spatial structure of disease spread.

The viruses we rested were Respiratory Syncytial Virus (RSV) and West Nile Virus (WNV). No COVID-19 data here. Sorry.

Although we make no prior assumptions on spatial structure, human movement patterns in the US explain 27%–30% of the estimated inter-state transmission rates. The transmission rates within states are correlated with known demographic indicators, such as population density and average age.

Our model also allows prediction of disease spread in subsequent seasons using the model parameters estimated for previous seasons and as few as 7 weeks of data from the current season.

The work was done mostly by our then intern, Dr. Inbar Seroussi.

The full paper:
https://www.sciencedirect.com/science/article/pii/S0378437120301692?via%3Dihub

Adverse reactions of e-cigarettes as visible in search engine data

On September 6th this year the Centers for Disease Control and Prevention (CDC) put out an Investigation Notice concerning a (suspected) outbreak of lung illness associated with using E-cigarette products. According to this notice, CDC is reviewing reports of a severe pulmonary disease associated with E-cigarette products, Following reports from 33 US states.

People who are suspected to have this disease report the following symptoms:

  • cough, shortness of breath, or chest pain
  • nausea, vomiting, or diarrhea
  • fatigue, fever, or weight loss

Brief summary if you want to decide whether or not to read further: Bing data seems to show that these symptoms appear in people who are likely using E-cigarettes, and offers a few additional likely symptoms.

I suspect it took a while to realize the possible adverse reactions associated with E-cigarettes because nobody thought of asking people who turned up at the doctors’ if they were using E-cigarettes.  Additionally, the CDC reports that it can take weeks and sometimes longer for symptoms to develop.

Late-appearing symptoms and ones that might not immediately seem obvious to a doctor are exactly the kinds of symptoms that people’s search engine queries are good at detecting. Thus, I turned to search data to see what it might show.

I extracted 9 months (October 2018 – June 2019) of Bing search data. I chose this period of time because it was well before information of the new pulmonary disease were widely reported in the media. These data include searches by people in the United States. Each record comprises of the text of the search, it’s time and date, and an anonymous user identifier.

To analyze the data I followed the methodology Evgeniy Gabrilovich and I developed for our paper on pharmacovigilance, which showed that it was possible to discover new side effects of drugs from search data. Specifically, I filtered the data to focus on those users who mentioned E-cigarette products. My list comprised of general terms related to electronic cigarettes and vaporizers, as well as the brand names of popular E-cigarettes. Although not everyone who mentioned an E-cigarette in their queries uses them, our experience with other product suggests that many who mentioned them are users. Approximately half a million users mentioned these products in their queries during the data period.

I then found all mentions of one of 195 medical symptoms that these users made before or after the first time they queried for an E-cigarette product. As a control population I found all the users who mentioned symptoms in their queries but did not mention an E-cigarette product. For those users I picked a random reference date between their first and last query in our data. I also removed topical queries (which spiked for a few days and then disappeared) and popular queries that were obviously unrelated to medical symptoms. These include, for example, queries mentioning celebrities and their medical issues.

I then scored each symptom using QLRS statistics (see our 2013 paper). Briefly stated, a symptom will receive a high score if we saw a significant rise in the likelihood that it will be queried in the population that also queried for E-cigarettes after their first mention of the product, compared to the control population.

The symptoms that received the highest scores are shown in the table below. Notice that among the top 10 symptoms at least 4 are also mentioned in the CDC report. The Top 3 are all known symptoms.

Symptom Mentioned in CDC report
Pain Y
Cough Y
Weight loss Y
Depression  
Anxiety  
Perspiration  
Headache  
Fever Y
Rash  
Itch  

Incidentally, some of the other symptoms reported by CDC are ranked high, though not in the top 10. For example, diarrhea is ranked 12th.

The temporal profile of symptom mentions seems to support the CDC report. In the figure below I plotted the likelihood that a person in the E-cigarette population would ask about cough over time, normalized by the likelihood of asking about cough in the control population. According to this figure, in the first few days after the first mention of an E-cigarette product, cough is slightly less likely and than in the general population. However, within a few weeks, cough becomes more prominent, to the point that it’s about 20% more likely than in the control population.

The temporal profile of queries for cough. Day zero is the first time that a user asked about E-cigarettes. The vertical axis is the likelihood of asking about cough, relative to the same in the control population.

Given these findings I would suggest that search query data shows the traces of this mysterious new pulmonary disease, recently reported by CDC.

These results also suggest the people that researchers should investigate the possibility of additional adverse effects of E-cigarette use including depression,  anxiety, and perspiration.

Why a blog and not (just) a paper?

Crowdsourced Health is a research project which aims to learn about health and medicine from online data. The latter include search engine queries, social media, and other online data.

The output of the project is published in academic papers, listed here. Each paper I’ve published is accommodated by a social media post describing the paper, for people who prefer not to read the more lengthy paper.

During our work we often have findings that are interesting, but perhaps not worth an entire paper. That’s why I’m going to try a new publication format, through short, concise blog posts. I hope these will be interesting for you.