COVID19: How are we doing?

Note: The following is somewhat different from my usual blog posts because it doesn’t involve internet data. It’s my analysis of publicly available health data which I did to answer a question I had.

The current phase of the COVID19 pandemic is affected by several trends which are driving the pandemic in opposing directions. One the one hand, the vaccination rate is high in many developed countries. On the other, new strains such as the Delta strain are more infective and the vaccines are thought to be less effective against these strains (even though they are still highly effective!).

What is the overall trend?

Scotland may be a good area to examine this question. On the one hand, at the time of writing 54% of the population has received two vaccine doses (73% received only one). On the other, since mid-May 2021 the delta vaccine is the dominant strain in Scotland.

Here is a plot of four indicators (source) of the pandemic: Number of daily positive cases, hospital admissions, ICU admissions and deaths. They are smoothed using a 7-day moving average. 

Four indicators of the COVID19 pandemic in Scotland

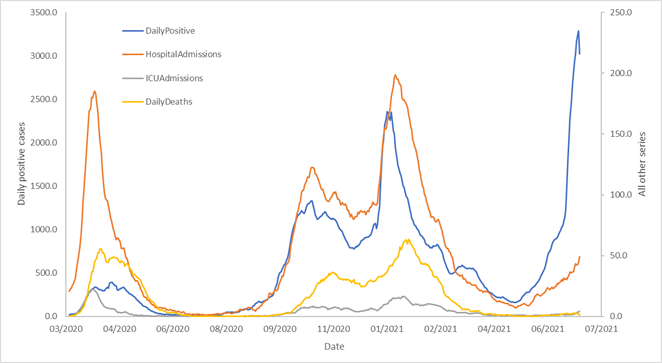
On average, hospital and ICU admissions are best correlated with daily cases when those are taken 7 days later (that is, it takes around a week until a case is hospitalized), and another 7 days until deaths occur.

Therefore, I used the daily positive data to predict both hospital admissions and deaths at the appropriate lag (7 and 14 days). In both cases I used a non-linear model (second order polynomial to predict the quadratic root of the dependent variables) trained on data until the end of April 2021. The models had a good fit (R2=0.69 and 0.52, respectively).  

Here are the actual and predicted hospitalizations, compared to case numbers:

Daily positive cases, hospital admissions and predicted hospital admissions

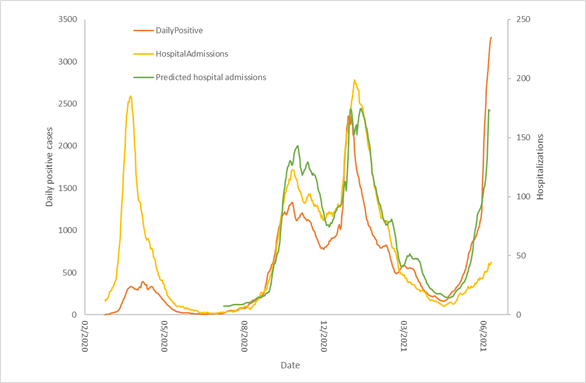
As we can see, hospital admissions are rising since mid-May, but not as fast as the prediction. We would expect around 170 people to be hospitalized at this point, but there are around 45. That’s around one quarter of the expected number.   

A look at deaths is even more telling:

Daily positive cases, deaths and predicted deaths

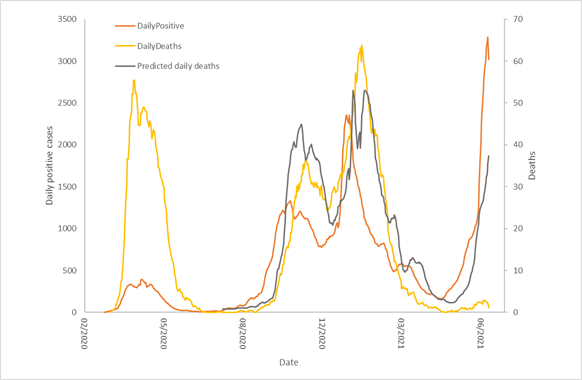
Deaths have risen very slightly: We would have expected almost 40 per day at this stage, but are seeing around 2 (that’s one twentieth of the expected!).

My takeaway from this is that we will see a rise in hospitalizations and in deaths, but it will be much smaller than in previous waves of COVID19, especially in terms of deaths. The vaccines are providing significant protection against the worst aspects of COVID19.

Why does flu happen in winter? COVID19 could help us answer the question

There are reports of a Respiratory Syncytial Virus (RSV) outbreak in Israel. RSV is a virus which causes a flu-like illness and is especially dangerous for children. What’s strange about this outbreak is that it’s happening in early summer, whereas previously RSV outbreaks always happened in winter.

I was wondering if this is something special to RSV and to Israel or perhaps something bigger?

Luckily, a few years ago we looked at the association of search engine query volume and the incidence of RSV and found that it was quite high. Therefore, I extracted Google Trends data (using the Google Trends Anchor Bank toolbox) for RSV from the US, United Kingdom and Canada and plotted it below:

Query volume for RSV in Canada, United Kingdom and United States between May 2016 and June 2021. Note that Canada and UK are on different axis from that of the US.

However, starting from April 2021 there is a dramatic rise of RSV in the US and UK, but not in Canada. Thus, Israel is similar to US and UK, but Canada seems an outlier.

Is there something special about RSV?

Here are the time series for several other seasonal viruses in the US:

Query volume for RSV, Rotavirus, Norovirus and Common cold in the United States between May 2016 and June 2021. Note that common cold is on a different axis from that of the other viruses.

Here we see similar correspondence, except for two outliers: First, common cold queries happened in the winter of 2021, but to a lesser extent. Second, RSV is rising, but so is norovirus, which started earlier and may already be on its way down.

Here is another virus, Rabies, compared to RSV. Rabies usually spike in summer, and in the summer of 2020 there was no spike. This year, however, it seems to be rising to normal levels. Note that it is unlikely that the search query volume for rabies represents rabies cases, as it does for RSV. Even though there is evidence for seasonality of rabies, in this case it probably reflects worry about rabies due to close contact with mammals.

Query volume for RSV and rabies in the United States between May 2016 and June 2021. Note that RSV is on the left axis and rabies on the right axis.

What’s happening here? Perhaps opening up for social gatherings in Israel, US, and UK have enabled RSV and other viruses to spike. We are looking into whether there is supporting evidence for this question.

These findings raise the interesting question of why RSV (and other viruses) occur in winter? Is it because of the colder weather which causes people to congregate indoors and perhaps constricts our airways? Is it because there is some level of immunity in the population which slowly decays over the year until, early in winter, it is low enough for an epidemic to begin?

COVID19 may allow us to resolve this question.

(Special thanks to Prof. Lev Muchnik for interesting discussions on this topic)